

Could Italy's rising debt-to-GDP ratio hint at hidden economic promise? Italy's debt now stands at 137.9% of its GDP, a number that makes you pause and wonder. Think of it like a runner slowly climbing a hill, each high number shows years of hard work and change. In this article, we'll explore Italy's long debt history and compare it with other EU countries, showing how these trends could clear the way for a brighter economic future.
Current Italy Debt-to-GDP Ratio in EU Context
Recent data shows Italy's public debt climbed to 137.9% of its GDP in the first quarter of 2025. This marks a 2.5-point increase from the last quarter of 2024. Meanwhile, the EU-27 average stands at 81.8%, up just 0.8 points from the previous quarter, a bit like comparing a house that suffered major storm damage to one with only minor roof repairs. Even minor percentage changes can mirror significant underlying economic challenges.
Different countries in the union are taking different paths with their debt. For example, Greece managed to lower its debt by 1.1 percentage points during the same period. Such differences can shift how investors feel and spark new policy ideas across the union. By keeping an eye on these shifts in debt, stakeholders get a clearer picture of where fiscal pressures are strongest and how quickly each country is adapting.
| Country | Debt-to-GDP Ratio | Quarter-on-Quarter Change |
|---|---|---|
| Italy | 137.9% | +2.5 ppt |
| EU-27 Average | 81.8% | +0.8 ppt |
| Greece | N/A | -1.1 ppt |
Historical Italy Debt Ratio Evolution and Key Milestones
Italy’s debt has stayed high for a long time, consistently staying above 100% of its GDP since the early 1990s. This means that every year, Italy owes more money than it produces in goods and services. Over the years, different events like financial shocks and public health crises have pushed the debt even higher. For instance, during the 2008 global financial crisis, Italy’s debt jumped quickly. Then, when the pandemic hit in 2020, extra government spending caused another sharp rise.
Even when other EU countries saw their debt levels improving, from 92% in the first quarter of 2021 down to 81.8% in the first quarter of 2025, Italy’s debt stayed high, showing that it has some long-lasting fiscal challenges.
Below are some key points that mark Italy’s journey:
- Since the early 1990s, Italy’s debt has been more than 100% of its GDP.
- The 2008 financial crisis saw a quick and steep rise in debt.
- Over the next ten years, Italy continued to manage high debt levels during economic changes.
- The 2020 pandemic led to another significant increase due to major spending efforts.
- While many EU countries saw debt reduction, Italy’s numbers highlight ongoing financial struggles.
These points remind us of Italy’s continuous battle with high public debt, a story shaped by many challenging moments over the years.
Drivers Behind Italy’s Elevated Debt-to-GDP Ratio
Italy’s high debt can be traced back to years of spending more than it earns and the heavy load of interest payments. Imagine having a credit card where the interest charges keep growing – that extra cost makes it tougher to pay off the balance.
Economic shocks have also taken their toll. During the pandemic, the government had to add extra funds to keep the economy running. And the effects of the 2008 financial crisis still linger, creating long-term challenges. All these factors together make balancing the budget a real struggle.
Evaluators from the IMF and EU even call Italy “sensitive” because its debt is more than 130% of its total economic output. In simple terms, this shows how long-standing fiscal policies and repeated economic setbacks have kept Italy’s debt high.
Comparative Fiscal Analysis: Italy vs. Peer EU Economies
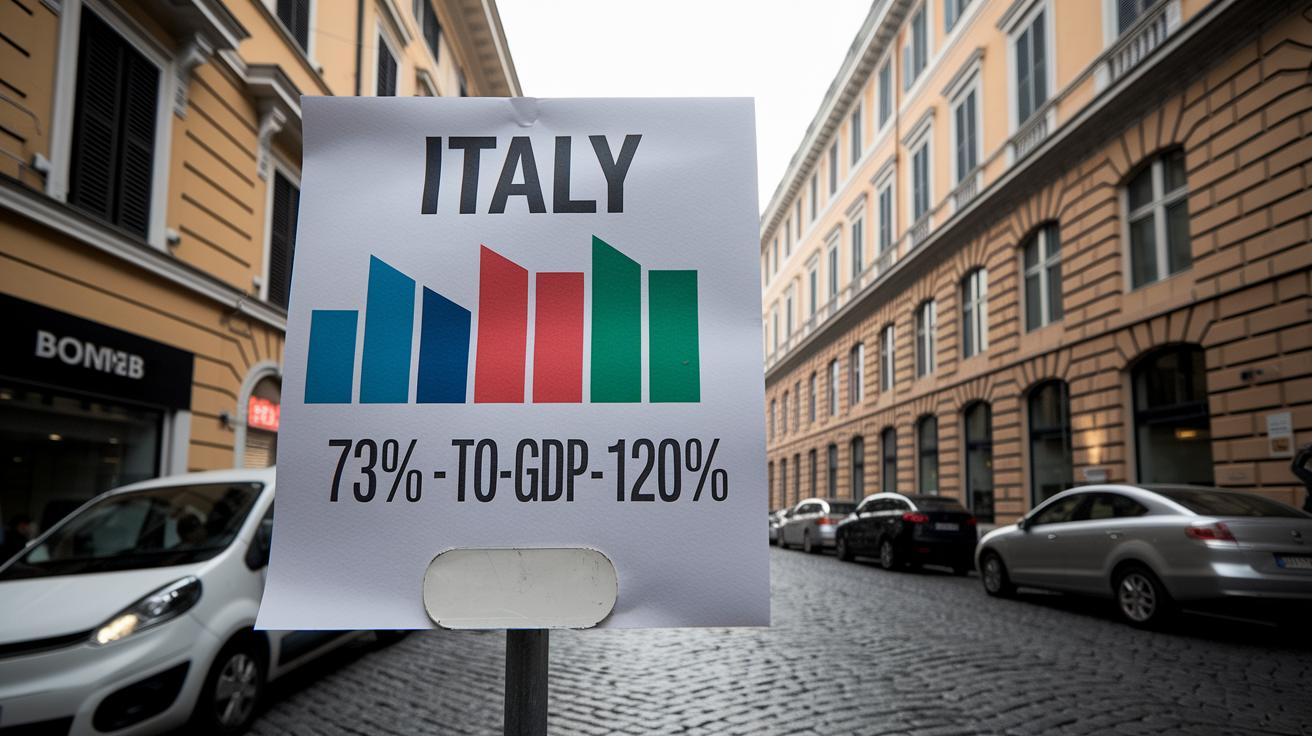
When you look at Italy's debt compared to its economy alongside other EU countries, the story is clear. In the first quarter of 2025, Italy’s ratio jumped by 2.5 points. That’s a noticeable change compared to some countries that have managed to keep their debt levels a bit lower. For instance, Germany ended up with a ratio of around 73%, which shows a steadier financial state. France sits at about 112% and Portugal at roughly 120%, showing a middle range when it comes to fiscal stress. These numbers help us see how different economic setups and financial policies can play out and leave us wondering if upcoming reforms might change the scene a bit.
Taking a closer look at other EU players reveals even more. Greece, for example, managed to reduce its ratio by 1.1 points. This is pretty interesting given that its debt level hovers around 186%. It shows that even when the numbers are high, some countries can make steps to ease their financial pressures. In fact, charts grouping 147 countries by risk for 2025 indicate that a number of southern EU countries fall into categories of higher financial risk. All this reminds us that every country has its own financial challenges and chances, making the European financial landscape as diverse as it is dynamic.
Outlook and Projections for Italy’s Debt-to-GDP Ratio
On the portal, you’ll find tools that let you play with different “what if” scenarios for Italy’s fiscal health. Think of these tools like weather forecasts for the economy, you can look at past charts and simulations to see how things might change. One tool could show what happens when the economy grows steadily and public finances improve, while another could warn of trouble if important reforms aren’t made on time.
Looking ahead to 2024–25, it seems Italy might see a small drop in its debt-to-GDP ratio if the economy grows faster and stays above 1.5% each year. This change would be a welcome shift after past increases, especially as key reforms come into effect. The EU Commission shares this positive view, hinting that fiscal pressures may ease gradually and the outlook could improve over previous years.
The forecast is based on a few important ideas: how fast the economy grows, whether needed reforms are put into place, and if the costs of managing debt level off. These factors work together to shape the forecasts, reminding us that a steady recovery relies on smart changes at home and a strong overall economy. In short, this balanced view offers hope for more financial stability in Italy soon.
Italy Debt to GDP Ratio: Bright Economic Outlook

Italy’s government leaders are taking clear and straightforward steps to handle rising debt. They use simple tools like sticking to strict budget rules and regularly checking spending. Think of it like taking your car in for routine service, small fixes now can help avoid bigger problems down the road. Experts suggest that careful budget cuts combined with reforms that boost growth can really make a difference.
Setting benchmarks is a key part of the plan. For example, the EU’s Stability and Growth Pact puts limits in place, like a 3% GDP cap for the deficit and a 60% cap for overall debt. Although Italy’s current numbers are above these targets, these benchmarks act like a roadmap, showing exactly where improvements are needed.
Looking at examples from the past provides useful insights. IMF experts, who study global economic trends, recommend a blend of tight spending control, reforms that encourage growth, and thoughtful restructuring of existing debts. Over time, clear policies paired with strict oversight have the potential to shift Italy’s debt trends toward a more promising economic future.
Final Words
In the action, we examined Italy’s current debt dynamics, traced its historical fiscal milestones, and unraveled the economic stresses that have led to a high italy debt to gdp ratio. We compared Italy to select EU peers and discussed tools and strategies that may guide future fiscal stability. This recap shows that understanding these elements can empower smart investment choices and foster clearer insights into market trends.
| Country | Debt-to-GDP Ratio | Quarter-on-Quarter Change |
|---|---|---|
| Italy | 137.9% | +2.5 ppt |
| EU-27 average | 81.8% | +0.8 ppt |
| Greece | 186% | -1.1 ppt |
FAQ
What is Italy’s debt-to-GDP ratio history?
The Italy debt-to-GDP history shows a trend of high fiscal leverage since the early 1990s, with notable spikes during the 2008 financial shock and the 2020 pandemic, emphasizing long-term fiscal challenges.
How does Italy’s debt-to-GDP ratio compare by country?
The Italy debt-to-GDP ratio, often exceeding 100%, contrasts with other nations. This comparison highlights fiscal stress in Italy relative to peers, where different economic pressures and policies lead to varying benchmark levels.
What do Italy’s debt in USD and GDP figures indicate for its fiscal health?
The Italy debt measured in USD reflects the overall borrowing magnitude amid currency shifts, while its GDP indicates economic output. Together, these figures provide insights into fiscal stress and the country’s economic stability.
How was Italy’s debt-to-GDP ratio in 2021?
The Italy debt-to-GDP ratio in 2021 remained high, signifying lingering fiscal pressures after the pandemic. This period captured ongoing challenges in reducing public debt relative to economic output.
Why is Italy facing such a high debt crisis?
The Italy debt crisis stems from long-term fiscal deficits, expensive stimulus measures, and slow growth. These factors have led to mounting debt burdens, raising concerns over sustainability and economic resilience.
What are the projections for Italy’s debt in 2025?
Projections suggest Italy’s debt may reach around 137.9% of GDP by early 2025. This forecast reflects ongoing fiscal pressures, policy adjustments, and potential economic slowdowns impacting debt levels.
What is considered a good debt-to-GDP ratio?
A good debt-to-GDP ratio is generally below 60%, indicating balanced fiscal conditions. Ratios above 100% typically signal higher financial strain and potential difficulties in managing public debt effectively.
Which EU country holds the highest debt-to-GDP ratio?
Some EU nations, particularly in southern Europe like Greece, display the highest debt-to-GDP ratios when compared to Italy, reflecting entrenched fiscal challenges that differ across the union.
