
Have you ever thought of the stock market as a kind of report card for your money? In this post, we're chatting about well-known names like the Dow Jones, the S&P 500 (which tracks 500 large US companies), and the Nasdaq, known for its focus on tech stocks.
These indices work like snapshots that show us the overall market mood. They tell you how companies are doing by looking at both past trends and today’s shifts. It’s like comparing your report card from last year with your current grades, all in one simple glance.
If you’re curious about how these measures can give you a clearer picture of the market, keep reading. You might find that understanding them is easier than you thought, just like figuring out a simple recipe for a favorite dish.
Key Major Stock Market Indices: Dow Jones, S&P 500 & Nasdaq Overview

A stock market index is like a snapshot that shows how a group of companies is doing. It gives you a quick picture, sort of like a school report card, telling you if the market is thriving or facing some hurdles. This way, complicated market shifts turn into something easier to grasp at a glance or during more detailed analysis.
The main indices in the U.S. are the Dow Jones Industrial Average, the S&P 500, and the NASDAQ-100. The DJIA started in 1896 and tracks 30 of the largest companies. It originally focused on heavy industry but has since broadened its view. The S&P 500, which began in the 1950s, includes 500 major companies and covers about 70% of the total market value, giving you a wider look at economic health. Meanwhile, the NASDAQ-100 started in 1985 and features 100 key non-financial companies, with a strong lean toward tech, telecom, and biotech.
| Index | Companies | Start Date | Method |
|---|---|---|---|
| DJIA | 30 | 1896 | Price weighted |
| S&P 500 | 500 | 1950s | Market cap weighted |
| NASDAQ-100 | 100 | 1985 | Market cap weighted |
These indices are crucial benchmarks for investors. They mix a sense of history with today’s market moods and future expectations, helping everyone from beginners to seasoned pros understand market trends. Many investors use index funds to mirror these measures, which makes building a balanced portfolio both simple and effective.
Global Major Stock Market Indices Across Regions

Global stock indices give investors a quick peek at how markets are doing worldwide. They work like a snapshot, showing how different companies across continents perform. By checking out indices from various parts of the world, you can see where markets are strong and spot opportunities that you might miss by focusing on just one area. This global view helps you understand how local news can affect markets far away and smooth out the ups and downs of single economies.
In Asia, indices show rapid growth and tech-driven changes. Take the Shanghai Composite in China, the Nikkei 225 in Japan, and the Hang Seng in Hong Kong, they give clear signals of how these regions are doing. They keep an eye on important areas like technology, industry, and finance. For instance, the Nikkei 225 once shot past 10,000 points during a tech surge in Japan, demonstrating a burst of market energy.
European indices open a window into established markets known for steady industrial output. The DAX 30 in Germany, CAC 40 in France, and FTSE 100 in the United Kingdom track well-known companies and long-term trends. They reflect years of market changes and policy updates that have helped shape steady economic conditions. Think about the FTSE 100, which has gradually changed over time with ongoing regulatory shifts and market adjustments.
In Latin America, the BOVESPA Index in Brazil captures the feel of an emerging market. It mirrors fast-paced economic shifts and shows the unique patterns of local markets in a region with growing promise.
| Index Name | Region/Country | Key Feature |
|---|---|---|
| Shanghai Composite | China | Broad economic indicator |
| Nikkei 225 | Japan | Tech and industry gauge |
| Hang Seng | Hong Kong | Financial market benchmark |
| DAX 30 | Germany | Blue-chip index guide |
| CAC 40 | France | Major French companies |
| BOVESPA | Brazil | Emerging market barometer |
Methodologies Behind Major Stock Market Indices

Major stock market indices follow clear rules and methods that help us see how healthy the market is. For example, the DJIA uses a price-weighted method. This means that each company’s share price directly affects the overall index. On the other hand, the S&P 500 and NASDAQ-100 are market cap-weighted, which simply means that companies with higher market values have a bigger impact on the index. Think of it like a race: some runners shine because of their speed (price), while others lead because of their overall strength (market cap). While the DJIA focuses on 30 well-known companies, the S&P 500 covers 500 large U.S. stocks and the NASDAQ-100 picks the top 100 non-financial companies.
Another important part of these indices is their rebalancing schedule. The S&P 500 has a review every quarter to make sure it still reflects current market conditions, while the NASDAQ-100 gets updated at regular intervals. These updates are like tune-ups that help the indices keep up with market changes and shifts in investor mood. This way, they stay useful snapshots of how the market is really performing.
Performance Trends and Historical Evolution of Major Stock Market Indices
Historical charts make it easy to see how big stock market indices have evolved over time. They turn many years of numbers into simple graphs, sometimes showing daily trends over 10 years or yearly returns, to highlight steady changes in the market. For instance, one chart shows a 100-year picture of the DJIA, another maps 90 years for the S&P 500, and yet another covers 45 years for the NASDAQ Composite. These visuals help investors grasp long-term growth and the shifting economic environment.
Key moments really jump out in these charts. Take the DJIA: a sharp drop during the 1929 bear market shows just how quickly market mood can change during tough times. There are also charts that break down performance by presidential terms, making it clear how changes in leadership, policies, and global happenings shape investor behavior over the years.
Risk is always a big part of the story. The VIX Volatility Index acts like a daily mood ring for the market, with its history clearly showing how market jitters rise and fall along with broader trends.
Comparative Analysis of Major Stock Market Indices

Ratio and valuation comparisons are key to understanding market indices. Since 1971, the NASDAQ versus DJIA ratio chart has shown us how the market relationship changes over time. Investors also look at measures like the Dow-to-GDP ratio and the S&P 500 PE Ratio to see if market prices match how the economy is doing. In short, these numbers give us a clear snapshot of market strength.
Volatility adds another twist to our analysis. Standard deviation helps us see the range of price movements, and beta tells us how much an index reacts to market swings. A higher beta means the index is more sensitive to changes, while standard deviation shows the overall ups and downs. This information is useful for spotting risks as well as opportunities, helping us understand when the market might be more unpredictable.
Putting these comparisons side by side gives investors valuable insights. Looking at ratios, valuation, and volatility together paints a clear picture of market trends. This approach not only highlights key patterns but also guides decisions based on how much risk you’re ready to take. It’s all about balancing growth opportunities with a bit of caution.
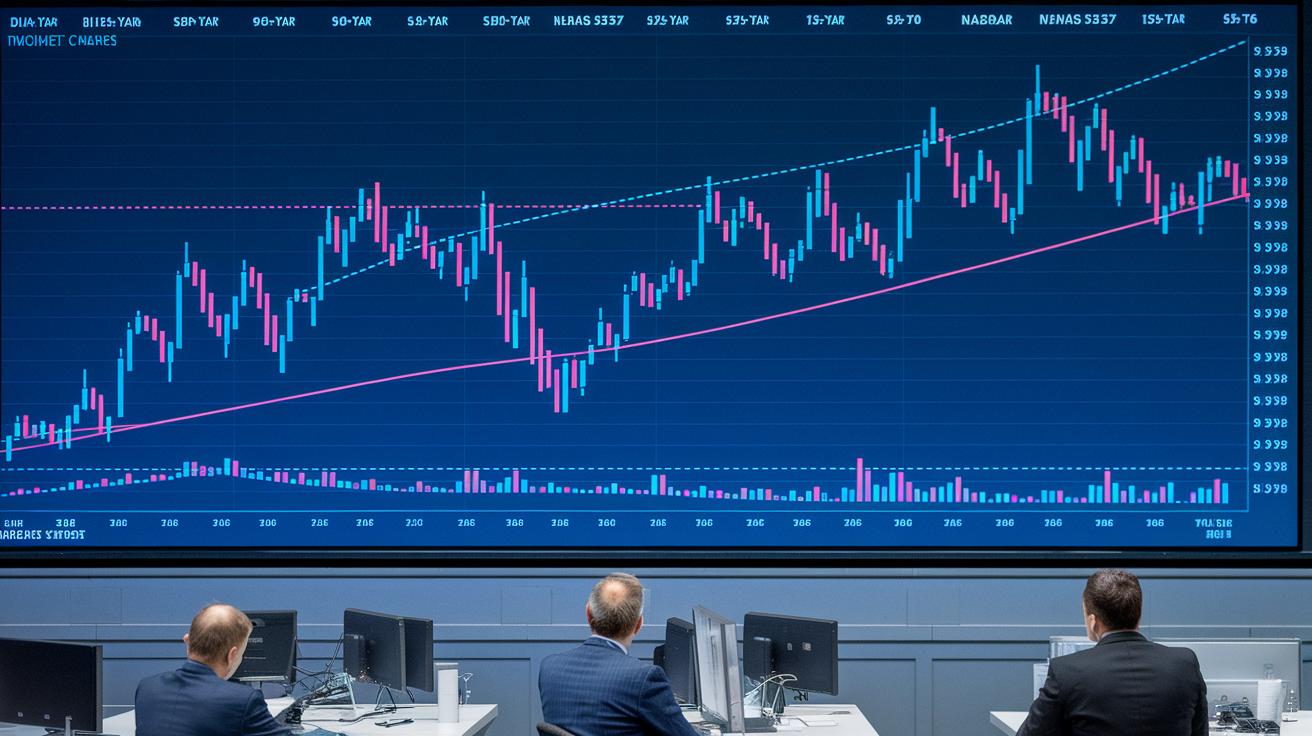
Real-Time Tracking and Live Metrics for Major Stock Market Indices

In today's fast-paced market, live tickers and data-stream tools are like a quick check on the pulse of the stock world. Live ticker feeds update the numbers several times each second, giving you a real-time look at market performance. Think of it as watching a heartbeat, when a big change pops up, it stirs excitement, and you can see the numbers shift right before your eyes.
Before the regular market opens, pre-market indicators and futures contracts give you an early peek at the day’s direction. It’s a bit like checking the sky before you head out on a road trip. This early data lets you sense the mood of the market and adjust your strategies accordingly, so you can start the day feeling more sure about your moves.
Many platforms also offer real-time volatility gauges and session updates. These tools keep track of risk changes every minute, offering a clear window into the market’s mood during trading hours. With these live metrics at hand, you can respond quickly to even short spurts of change, making smarter decisions and adding extra confidence to your trading approach.
Leveraging Major Stock Market Indices for Portfolio Diversification

Many investors choose tools like ETFs and mutual funds because they give a taste of the whole market. These funds follow well-known indexes that include lots of companies across different sectors, making it easier to build a balanced portfolio without picking each stock yourself.
By copying popular benchmarks, you can join in on the overall market in a simple way. It’s like buying a ready-made mix of stocks that covers many industries at once, which helps spread out your risk.
Mixing indexes from regions like the U.S., Europe, and Asia lets you tap into different growth opportunities while keeping your risk in check. This global mix means that if one part of the world isn’t doing well, the others can help cushion the blow. For more on how spreading your investments can lead to steadier gains, check out this resource on global market diversification benefits and challenges.
Final Words
In the action, we examined key U.S. equity benchmarks and their methods, performance trends, and live tracking measures. We looked at well-known indices like the DJIA, S&P 500, and NASDAQ, and saw how they work with global indicators for portfolio diversification. By breaking down historical shifts and real-time updates, we shed light on how these tools guide financial strategies. With insights from major stock market indices, investors can step forward with greater understanding and positive momentum.
FAQ
Frequently Asked Questions
Q: What are the major stock market indices and the 3 major stock indexes?
A: The major stock market indices, often referred to as the 3 major stock indexes, are the Dow Jones Industrial Average, S&P 500, and NASDAQ-100. They provide a snapshot of market performance and investor sentiment.
Q: How can I view a live chart or graph of the major stock market indices?
A: The live charts and graphs for major stock market indices display real-time updates, allowing investors to track performance trends and market shifts as they happen throughout the trading day.
Q: What is the big 7 in the stock market?
A: The term “big 7” informally refers to a select group of widely followed indices or market metrics. Its exact definition can vary, so it’s wise to check the latest context from trusted financial sources.
Q: Should a 70-year-old get out of the stock market?
A: A 70-year-old’s approach to stock market investing depends on individual risk tolerance, financial goals, and overall portfolio diversification. Seeking advice from a trusted financial advisor is a prudent step.
Q: Will the stock market be closed for Juneteenth?
A: The stock market is closed on Juneteenth as it is recognized as a federal holiday in the United States. Always verify with official sources for any changes or additional market closures.
Q: What are the top 10 stock markets in the world?
A: The top 10 stock markets are determined by market capitalization and trading volume, typically featuring leading exchanges in the United States, Europe, and Asia. Check recent rankings on trusted financial platforms for the most current list.