

Ever thought about whether solid numbers could outdo gut feelings? Quantitative investing uses market numbers, smart math, and programming along with a bit of human insight to turn data into clear ideas. Think of it like a puzzle where every piece of information fits together to guide smarter trading choices. This mix helps investors act quickly and wisely, using fast data and careful thought. We're here to show you how these methods can lead to success and even change the way you see investing.
Fundamentals of Quantitative Investment Strategies
Quantitative investment strategies use math-based tools to help understand the market. They rely on ideas like probability (the chance something will happen) and statistics (the study of numbers) to gauge risks and forecast asset movements. Think of it like putting together a puzzle, where each number or trend is a small piece that helps reveal the bigger picture. Even though high-speed trading tech is key here, a human touch still matters.
Automated trading systems work alongside these math models to make trades quickly and smoothly. They use fresh market data to sharpen algorithms and adjust portfolios as conditions change. In truth, this blend turns raw numbers into clear, actionable decisions that bring theory into everyday practice.
Even with smart machines at work, human insight remains essential. Expert analysts watch the results, fine-tuning models and settings when the market shifts. This mix of careful math and real-world judgment captures the adaptive spirit of quantitative investment strategies.
Designing Algorithmic Portfolio Models & Systematic Trading Methods
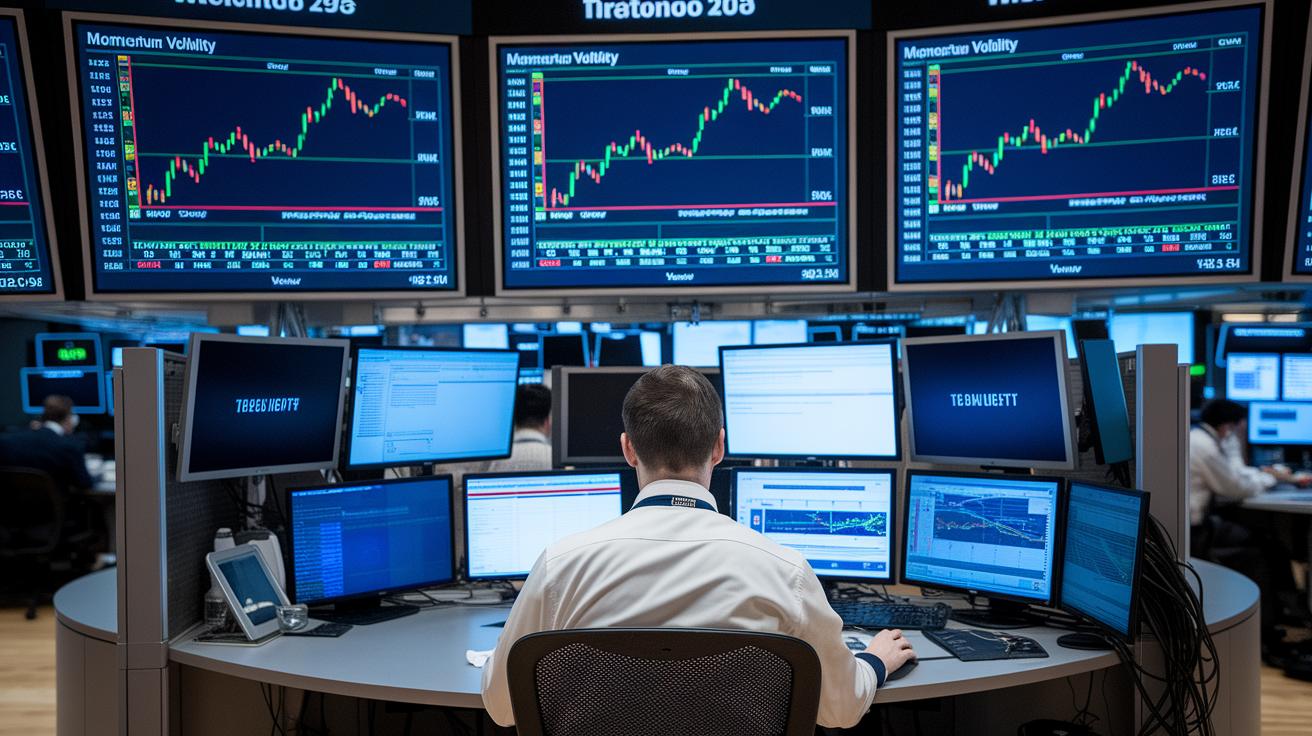
Building a strong model starts by collecting data straight from the exchanges and other reliable sources. This raw data is like the essential ingredients you need to whip up a great recipe. Next, we shape this data by picking important elements such as momentum, value, and volatility (volatility explains how much an asset's price can swing up or down). Think of this step like choosing the right mix for your favorite dish: every ingredient changes the final flavor. Some traders even use tools that pinpoint trends, helping them spot those key patterns that influence their decisions.
After lining up the data and key factors, we fine-tune the model and set it to work automatically. To ensure the model mirrors real market behavior, we use methods like mean-variance (balancing risk and return), multifactor, or timing adjustments. Once these models are ready, automated systems jump in to execute trades across stocks, bonds, currencies, and commodities. Reliable tools like Python along with libraries such as QuantLib and pandas act as the sturdy backbone, keeping everything running smoothly as market conditions change.
- Get data from multiple exchanges and other trusted sources.
- Shape the data with feature engineering and select key factors, using trend tools to spot important patterns.
- Fine-tune the model with techniques like mean-variance, multifactor, or timing adjustments.
- Automate trade execution across equities, fixed income, FX, and commodities.
- Monitor everything continuously using real-time trading dashboards.
This systematic process ties every step of building algorithmic portfolio models together. By carefully handling data, choosing clear factors, and running reliable automated systems, quantitative investment strategies become a solid way to make smart, data-driven decisions, even when markets shift unexpectedly.
Implementing Quantitative Risk Management & Statistical Arbitrage Analysis
Risk management helps us measure various risks using clear, easy-to-understand figures. We often use numbers like VaR (Value at Risk, which tells you the worst loss you might face over a certain time) and CVaR (the average loss you could see beyond that risk). We even run stress tests to see how a portfolio might react during unusual market swings. Some models also include extra checks, known as xVA, to meet regulatory requirements and help firms keep an eye on risks from sudden market moves or counterparty issues. For more details, you can check out this link to digital finance risk management.
Statistical arbitrage, on the other hand, looks for tiny opportunities when prices seem a bit off for just a short time. It’s a bit like spotting two nearly identical items where one suddenly costs less. In these cases, the strategy bets that their prices will come back in line. Traders use simple ideas like mean-reversion and pair-trading, along with careful tests and designs, to catch these fleeting chances. This blend of techniques can spot little trends that might otherwise be hidden in plain numbers.
Together, these approaches shine a light on those hidden market signals. By building strong models that check both overall market risks and specific details, traders can try out their ideas before actually risking money. This smart mix of clear risk checks and data-driven tests makes investing a process that quickly adapts as the market shifts.
Leveraging Financial Data Analytics & Machine Learning Trading Tools

Big-data platforms sift through tick data, order-book details, and extra market signals to find trends and opportunities. These systems turn piles of raw market information into quick insights that traders can use. With smart financial data analytics, even the smallest shifts in the market become clear, making investment choices easier to understand.
Machine learning tools take these insights a step further. They use models like regression, random forests, and neural networks, which are essentially computer programs that learn from past market behavior, to predict price changes. This extra layer of analysis helps traders spot hidden trends and fine-tune their strategies for different market conditions.
Open-source libraries and powerful computing frameworks also have a big role to play. They help these models run well in real time by allowing fast checks and thorough backtesting. In other words, traders can quickly test and adjust their strategies as market conditions change. By mixing careful data checks with adaptable machine learning, traders have a strong setup to catch clear market signals and build smarter, data-driven plans.
Evaluating Performance Metrics & Backtesting Protocols for Quant Strategies
Performance metrics are like a report card for quantitative investment strategies. They help you see how well a strategy is doing by measuring things like the Sharpe ratio, the Sortino ratio, and the maximum drawdown. The Sharpe ratio looks at how much extra return you get compared to how much the strategy wiggles (volatility). The Sortino ratio focuses on the bad days, showing you only the drops in value. And maximum drawdown tells you the worst drop from a peak, which is like scouting for the worst-case scenario. Together, these numbers give a clear picture of a strategy’s strengths and risks.
Backtesting protocols are our safety net. They mimic real trading by using methods such as walk-forward analysis and out-of-sample tests. These methods help keep bias at bay by not letting past data overly guide the future. They also add details like transaction costs and slippage (that’s when trades don’t get filled exactly as planned) to bring the tests closer to real-life trading. By running a lot of tests and tweaking along the way, you build more trust that the strategy will work even when markets change.
| Metric | Description |
|---|---|
| Sharpe Ratio | Shows extra return compared to overall volatility. |
| Sortino Ratio | Focuses on negative ups and downs to capture downside risk. |
| Maximum Drawdown | Highlights the biggest drop from the highest point. |
Final Words
In the action, we’ve covered the essentials, from understanding mathematical finance techniques and data-driven insights to designing algorithmic portfolio models and using statistical methods for risk management. We discussed how machine learning and robust backtesting can drive smarter decisions.
The blog explored every step to help you feel confident in expanding your market insights. Embracing quantitative investment strategies can pave the way to a more informed and positive investment experience.
FAQ
What is a quantitative investing strategy and how do quantitative methods support it?
The quantitative investing strategy uses math, statistics, and data analysis to shape decisions. It applies techniques like probability and algorithmic trading to build and manage investment portfolios.
Where can I find literature such as PDFs or books on quantitative investment strategies?
The literature on quantitative investment strategies is available in finance libraries, reputable websites, and online research portals, providing detailed insights into mathematical techniques and data-driven approaches.
What are some examples of effective quantitative investment strategies, including the best quant strategy?
Effective strategies often combine data analysis with algorithmic models. Examples include mean-variance optimization, momentum-based methods, and risk parity models, each designed to balance returns with risk.
What quantitative strategies does Goldman Sachs implement in its investment framework?
Goldman Sachs uses a mix of algorithmic trading, statistical arbitrage, and risk management. Their models include machine learning and real-time analytics to build and adjust portfolios suited to market conditions.
What jobs exist in the field of quantitative investment strategies?
Jobs in this field range from quantitative researcher and data analyst to portfolio manager. Professionals work with statistical models, coding, and backtesting to develop and refine investment strategies.
What defines quantitative investment funds and how does quantitative management work?
Quantitative investment funds use mathematical models to select assets and manage risk. Their management relies on data analytics and automated systems to continuously monitor and optimize portfolio performance.
What is the 70 20 10 investment strategy?
The 70 20 10 strategy divides investments into three segments: 70% in stable core assets, 20% in growth opportunities, and 10% in speculative positions, aiming to balance steady returns with potential gains.