
Have you ever wondered if looking at just the average trade price really shows you everything? VWAP, or Volume Weighted Average Price, steps in to show what an asset is really worth by giving extra weight to larger trades. Think of it like a school report where students who put in extra effort get a higher grade. VWAP smooths out sudden price drops or spikes to illustrate a clearer picture. In this guide, we break down how VWAP works and why both beginners and seasoned traders rely on it to make smarter trading choices.
Understanding VWAP in Trading
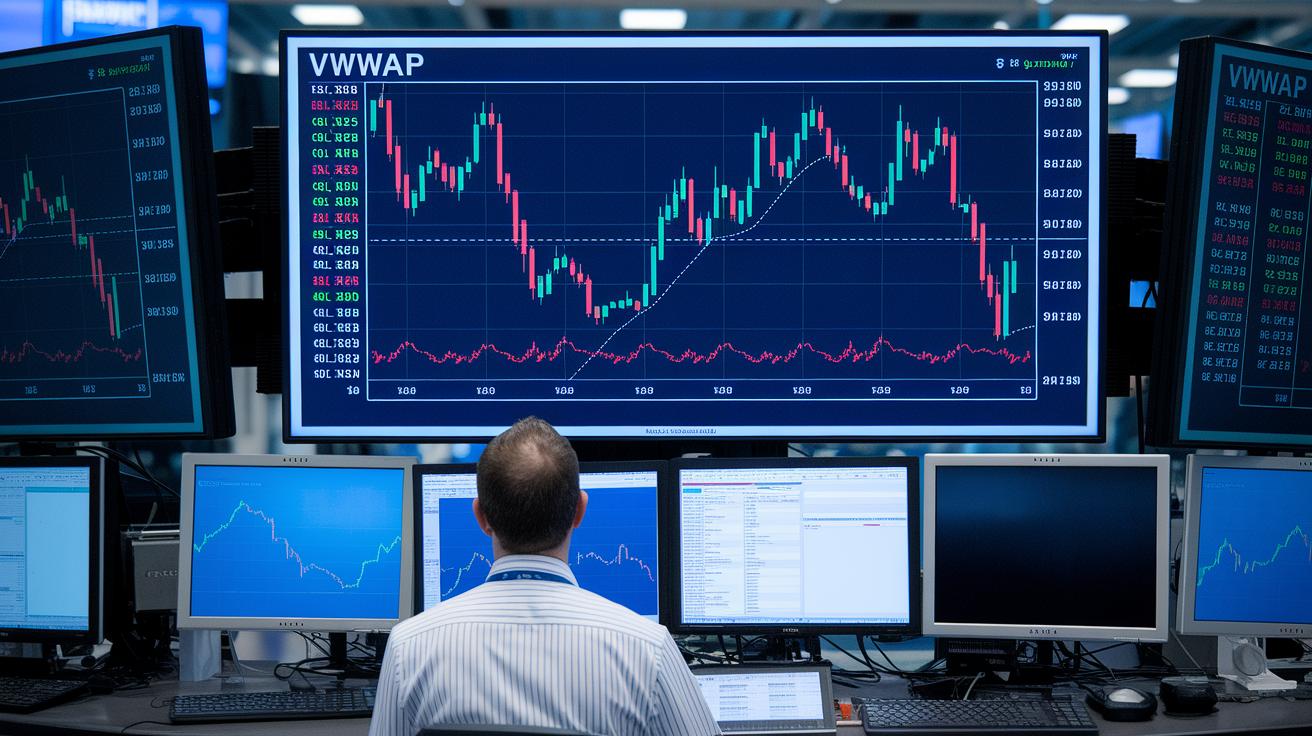
VWAP stands for Volume Weighted Average Price. It is a tool that tells you the average price of an asset based on how much it is traded. Think of it like finding the class average exam score but giving more weight to the students who studied longer. It mixes both the price and the number of trades into one useful number.
This indicator helps traders see an asset's real value by cutting through wild price swings and big trades that can cloud the picture. Both new and experienced traders use VWAP to get a feel for the market during active trading.
When prices are above the VWAP line, it usually means buyers are in control. This suggests that the market may favor long positions, as noted in strategies on Day Trading for Beginners. On the other hand, if prices drop below the line, sellers might be leading the charge. VWAP was first used back in the 1980s to manage risk and is reset at the start of each trading day to give fresh data.
Big institutions and algorithmic systems use VWAP to check their trade performance and ensure that trades stick close to what is considered the fair market value. All in all, VWAP is a dependable tool that helps guide smart trading decisions.
VWAP Calculation Formula and Step-by-Step Guide
The VWAP tells you the average price of a security based on trading volume during a session. To figure it out, you first multiply each trade's price by its volume, then add up all those results. Next, divide that total by the overall trading volume. This calculation resets at the start of every trading day, so you always have up-to-date information on price and volume. You can use a spreadsheet, a custom script, or even a handy online calculator for quick results.
Here’s a simple way to break it down:
- Start by gathering all the necessary data: each trade's price and its volume.
- Multiply the price of each trade by its corresponding volume.
- Keep a running total of the price-volume products, as well as a running total of the volumes.
- Finally, divide the total result from the multiplications by the sum of the volumes to get the VWAP.
| Calculation Step | Description |
|---|---|
| Input Gathering | Collect all the prices and volumes for the trades during the session. |
| Price-Volume Multiplication | Multiply each trade’s price by its volume. |
| Running Sums | Add up all the price-volume products and the total volumes. |
| Final Division | Divide the sum of the products by the total volume to calculate the VWAP. |
Using VWAP as Dynamic Support and Resistance
VWAP is like a daily average that can act as a soft cushion when prices drop from above. Imagine a stock coming down toward this line, often, buyers step in and make it bounce back quickly. It’s as if the line says, "I got you!" That bounce tells traders that this safety net might pull prices back toward the average.
When prices fall below VWAP, things change a bit. The line then acts like a barrier, pushing back against rising prices. Big players sometimes use this to help guide prices back to the average for smoother trades. If a price breaks below the VWAP, it can be a sign of strong selling pressure. But if it recovers swiftly, it might hint that a turnaround is on its way. Overall, VWAP does double duty, supporting prices coming down from above and resisting those that fall too far below, which helps everyone get a clearer picture of the market’s mood during the day.
VWAP Trading Strategies for Day Traders and Institutions
VWAP is a smart tool that uses live market information to help decide when to buy or sell. Day traders often check it right after the market opens to see how strong the movement is. If the price climbs above VWAP, it usually means buyers are taking control, hinting at a good time to buy. On the flip side, if the price falls below VWAP, it might be a signal to sell. Since VWAP links the price to the number of trades happening, large volumes naturally weigh more on the average. This makes the tool great at smoothing out sudden price jumps and spotting change points. Adding VWAP to other indicators can sharpen these signals and help manage risks, so traders can handle unexpected market turns while keeping the overall trend in view.
Institutional traders use VWAP a bit differently. Big players try to buy when prices are below VWAP and sell when they exceed it. This method keeps their large orders from shaking the market too much. VWAP makes it easier to time such orders so they happen near the true average price, lowering risks and meeting strict benchmarks. Whether you’re a day trader or handling large orders, mixing VWAP with other signals can lead to better, more precise decisions.
Day Trader Framework
Day traders keep a close eye on VWAP right from the start of the market session. They watch to see if the price moves above it, which could mean it's time to buy, or below it, which might point to selling. This easy-to-follow setup helps them quickly understand the market mood and act fast as things heat up.
Institutional Execution Techniques
Big institutions rely on VWAP as a benchmark for carrying out large orders with minimal market disruption. They aim to buy when the price is below VWAP and sell when it goes above. This smart approach helps them manage risks and secure trades that are as close as possible to the fair, average price.
Advanced VWAP Applications: Anchored VWAP Techniques
AVWAP Pinch sets the calculation starting point from a reaction high or low and then zeroes in on a tight range right before a breakout. It’s like looking closely at the calm moment before a sudden wave. This method helps traders prepare for the next big swing by focusing on that critical, narrow zone.
AVWAP with Percentage Bands builds on the basic anchored method by adding a bit of extra room around the line. Think of it as a safety cushion that accounts for small, natural price wiggles. This makes sure that little deviations don't trigger early moves in automated trading systems, making the tool more forgiving, especially when the market isn’t too wild.
Continuous Re-Anchoring is all about keeping the VWAP fresh. Every time a new swing high or low appears, the anchor point gets updated. By doing this, the indicator mirrors the changing feelings of the market, giving traders up-to-date insights they can rely on.
Volume-by-Price Anchored VWAP ties the calculation to clusters of trading volume at specific price levels. These clusters act like natural road markers, showing where trading has been heavy in the past. Traders use these key levels to decide when to jump in or step back, based on areas that have previously seen strong market reactions.
| AVWAP Technique | Value | Typical Use Case |
|---|---|---|
| AVWAP Pinch | Highlights a small zone before price action picks up | For spotting imminent moves |
| AVWAP with Percentage Bands | Adds a buffer to handle small price changes | Helps automated trading systems avoid false signals |
| Continuous Re-Anchoring | Resets with every new swing high or low | Keeps analyses fresh to match market moods |
| Volume-by-Price Anchored VWAP | Uses trade clusters as natural key levels | Identifies support and resistance zones |
VWAP Compared to Moving Averages and Other Indicators
VWAP uses the trading volume to give each price a weight and resets at the start of each session. This means it captures the market’s mood right then and there, unlike moving averages that blend data over several days. Think of it like tweaking a recipe for every new batch so you always get a fresh result.
Another smart thing about VWAP is that it cuts down on the noise from unusual trades. This gives you a clearer picture of the day’s true balance between buyers and sellers. Meanwhile, moving averages tend to lag when there are sudden surges in volume, making them better for spotting long-term trends rather than quick shifts.
VWAP Limitations and Best Practices for Traders
VWAP resets at the start of every trading day. It’s best used during the day because it only shows data from that session. Since the count starts fresh when the market opens, it only reflects what’s happening now. Sometimes, one very big trade can push the VWAP too high or too low if there aren’t enough other trades to balance it out. And when there isn’t much trading happening, the signals it gives might not be very reliable. Remember, VWAP isn’t meant to predict where prices will go next; any changes in it should be viewed carefully, not as a crystal ball.
For a better market view, try using VWAP along with other tools that show trends or momentum. Mixing these tools helps cut down on weird spikes from one large trade or unusual market activity. You might also look at using an anchored VWAP, where you set your starting point around an important market event. And if trading is light, don’t rely on VWAP alone. Using these techniques together can help you get more consistent and trustworthy signals for your trades.
Final Words
In the action, we explored how VWAP captures price trends based on volume, offering insights into market sentiment. We walked through its calculation steps and demonstrated its role as dynamic support and resistance. The article also shared practical strategies for day traders and institutions along with advanced anchored techniques. It even compared VWAP to moving averages and highlighted its limitations in low-volume scenarios. This dive into what is vwap in trading leaves you better equipped to approach market moves with clarity and confidence.
FAQ
What is VWAP in trading strategy?
VWAP, or volume weighted average price, is a tool that calculates the average price of an asset based on traded volume. It shows whether buyers or sellers control the market and is used by both day and algorithmic traders.
What is the VWAP formula?
The VWAP formula is calculated by multiplying each trade’s price by its volume, summing these results, and then dividing by the total volume traded during the session.
How do you trade using VWAP?
Trading with VWAP means watching for price to cross above or below the VWAP line to indicate potential trade entries or exits. Day traders often use this method to confirm market direction after the open. Day Trading for Beginners
Is VWAP a good indicator?
VWAP is a useful indicator because it reflects an asset’s average price based on volume, lending insight into market control. It works best when combined with other analysis tools for confirming signals.
What information does VWAP tell you?
VWAP tells you the average trading price weighted by volume, indicating if buyers or sellers dominate during a session and helping gauge fair market value.
What is a VWAP calculator?
A VWAP calculator is a tool that computes the weighted average price in real time by processing each trade’s price and volume. It streamlines monitoring of market conditions to support trading decisions.
What is the 3 5 7 rule in day trading?
The 3 5 7 rule in day trading refers to a guideline that uses specific time intervals or criteria to confirm price patterns before entering trades. It offers an additional check but should be used alongside other analysis methods.